Change Your Project Approach with a Power BI Dashboard Report
In the world of project management, making timely and informed decisions is crucial. With ChatPM Pro, the integration of a Power BI dashboard report offers a compelling solution: it transforms scattered data into meaningful, real-time project insights.
Why a Power BI Dashboard Report?
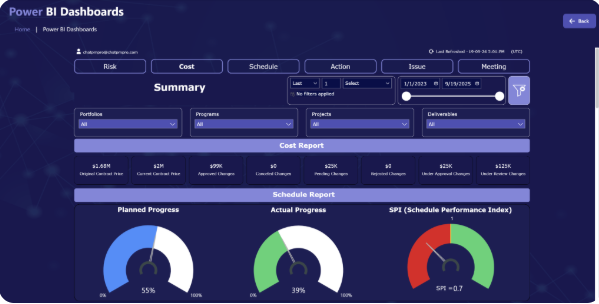
A Power BI dashboard report acts as a centralized hub for visualizing key project metrics—scope, cost, schedule, risks, issues, actions, and more. Dashboard reports allow stakeholders at all levels to grasp project health instantly, reducing reliance on laborious spreadsheets and manual reports. As data updates, the dashboard evolves too—ensuring teams always access the most current information. This continuous, visual clarity empowers fast, fact-based decision-making.
Core Features of ChatPM’s Power BI Integration
ChatPM Pro’s integration leverages the full power of Microsoft’s analytics platform to enhance project tracking and collaboration:
Customizable Data Visualization
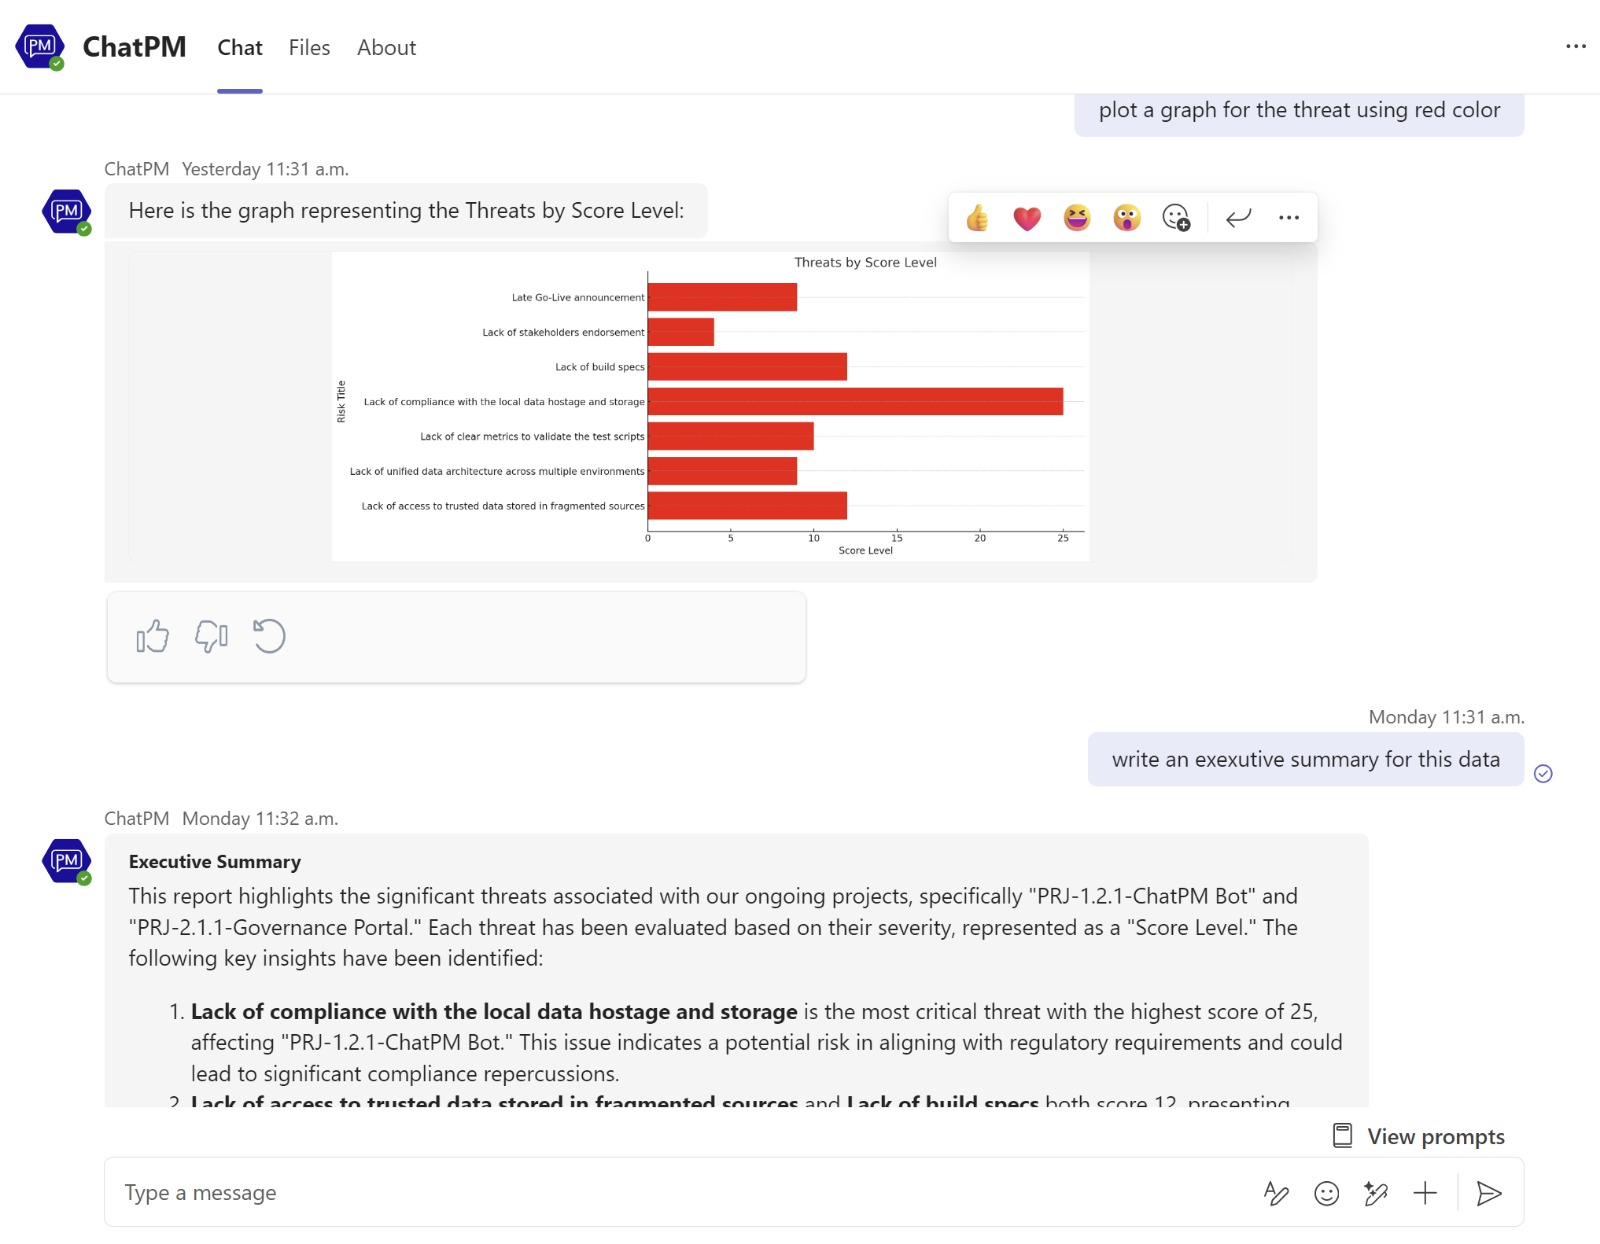
Tailor charts, gauges, trend lines, and tables to highlight what matters most. Whether it’s burn‑rate, earned value, risk heat‑maps, or action item progress, users can personalize dashboards to reflect project priorities.Real-time Analytics
Dashboards update live, pulling data from ChatPM’s centralized database. This ensures project leads and sponsors have access to up-to-the-minute intelligence—no more outdated numbers at review meetings.Interactive Reporting
Drill down on any chart or metric to uncover deeper layers. What looks like a minor budget slip might reveal resource bottlenecks or evolving scope—providing actionable insights with a click .Automated Dashboard Reports
Eliminate manual Excel crunching. Set up scheduled distribution of Power BI dashboard reports—such as executive summaries, risk registers, and cost analyses—to keep everyone aligned without overhead.
The Impact of Dashboard Reporting
Implementing a Power BI dashboard report within ChatPM Pro provides several tangible benefits:
Data-Driven Decision Making
Boost decision quality with real-time visual evidence—no more gut-feel or outdated numbers.Enhanced Project Oversight
View milestones, budget variances, risks, and actions in a single pane—ideal for project managers and PMOs.Improved Communication
Stakeholders—from team members to executives—can quickly digest visual snapshots tailored to their role.Efficient Reporting
Automate regular updates, freeing PMOs and analysts to focus on strategy rather than data compilation.
Key Use Cases for Power BI Dashboard Reports
Executive Summary Reports
Perfect for leadership reviews, these reports aggregate high-level metrics like cost performance, schedule status, and top risks.Risk & Issues Dashboard
Visually highlight top risk categories, open issues, and remediation status—helping teams act before problems escalate.Financial & Cost Analytics
Track actual versus planned spend, analyze burn trends, and forecast future costs using interactive visuals.Schedule & Progress Tracker
Utilize Gantt visuals, milestone trackers, and variance charts to monitor project trajectory.Action Tracker
Quickly see open tasks, assignee workloads, and age of actions—ensuring accountability and progress.
Get Started Today
When you combine ChatPM Pro with a robust Power BI dashboard report, you gain a centralized, automated, and insightful project monitoring system. It’s designed to streamline PM workflows, boost transparency, and accelerate decision-making.
Experience the power of data-driven project management.
Visit ChatPM Pro’s Power BI Dashboards page to schedule a demo and explore real-time visualization at work

Comments
Post a Comment